WINGATE TESTING
INTRODUCTION: The Wingate Test is a simple way to measure how much anaerobic power a rider can generate on a bicycle over a 30 second interval. The test was performed on an ergometer, which can measure the output power and angular velocity for the rider. All team members performed the test twice to see any significant variation between the tests.
PROCEDURE: The rider warms up for 5 minutes against a zero torque resistance before the thirty second test begins. For the first four minutes the rider alternates between 45 seconds of easy riding and a 15 second sprint period to get the rider used to sprinting. For the final minute of the warmup the rider reserves his/her energy and just pedals very conservatively. The lab technician will then give the rider a countdown until the test begins. The rider will begin his sprint as the technician counts down to avoid a slow start due to the sudden application of resistance. Once the technician counts down to zero, a resistance torque is applied to the flywheel of the ergometer equivalent to 8.5% of the rider's body weight. The rider continues to pedal as fast as possible for the 30 second interval. The rider has been instructed to not reserve any energy and the riders usually plateau's half way through the test. At the end of the thirty second interval, the computer has collected the power output and cadence for rider over the duration of the test. Videos of the test and computer interface of the recording software are shown below.
PROCEDURE: The rider warms up for 5 minutes against a zero torque resistance before the thirty second test begins. For the first four minutes the rider alternates between 45 seconds of easy riding and a 15 second sprint period to get the rider used to sprinting. For the final minute of the warmup the rider reserves his/her energy and just pedals very conservatively. The lab technician will then give the rider a countdown until the test begins. The rider will begin his sprint as the technician counts down to avoid a slow start due to the sudden application of resistance. Once the technician counts down to zero, a resistance torque is applied to the flywheel of the ergometer equivalent to 8.5% of the rider's body weight. The rider continues to pedal as fast as possible for the 30 second interval. The rider has been instructed to not reserve any energy and the riders usually plateau's half way through the test. At the end of the thirty second interval, the computer has collected the power output and cadence for rider over the duration of the test. Videos of the test and computer interface of the recording software are shown below.
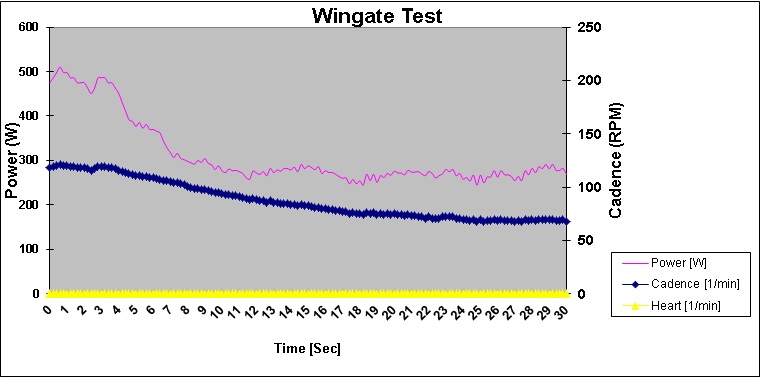
DATA ANALYSIS: The data from the test was imported into Microsoft Excel. Using the Data, values for peak power, power to weight ratio, average power, and the maximum drop in power. These values will be used to help design the drive train to the specifications of all the group members. A sample of the plotted data of Power and Cadence vs Time is shown below.